Newsletter statistics
Our April newsletter was sent out on April 15th, 2020, to 275 recipients. By April 22nd, 2020, 107 users (39.9%) opened it, most were from the United States, followed by Italy and Germany. 71 recipients (26.5%) clicked on at least one of the articles. The open rate and click rates were both higher than the previous campaign (34.6% and 17.1% respectively), and both indicators are well above the average performance of peers in the manufacturing industry (19.8% and 2.2% respectively, [data last updated in October 2019]).
Most read articles were:
Website statistics
In November there were 676 unique visitors coming to our website, which was less than in the previous month. Together visitors viewed 2,028 pages, on average 2.29 pages per visit. Visits lasted for 2:48 minutes on average.
In comparison with last month (October), the user count decreased from 792 to 676 and the page views decreased from 2,265 to 2,028. But the average duration of visits increased from 2:26 to 2:48 minutes and the average number of pages per visit changed from 2.26 to 2.29.
LinkedIn statistics
ESA LinkedIn page is continuously getting new followers. We have 1.252 followers so far, the majority is from Spain, followed by Germany and France. The average engagement rate of the posts in the last 3 months was 3.82%, ranging from 1.09% to 8.69%.
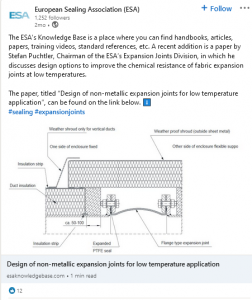
The most engaging post was the update about the ESA’s Knowledge Base with 12 reactions.

ESA LinkedIn group membership is continuously growing. There are currently 1,144 members that can participate in the group by asking questions, sharing solutions to a problem, or posting links. You’re invited to check our group regularly, read our post on why you should be using LinkedIn groups and start participating.
