Newsletter statistics
Our February newsletter was sent out on Wednesday, February 28th, 2018, to 380 recipients. By March 14th, 2018, 123 users (32.5%) opened it, most were from the United Kingdom, followed by Germany and the USA. 54 (14.2%) recipients clicked on at least one of the articles. The open rate and click rates were both a little above than the average for the ESA newsletter, and both indicators are well above the industrial average. Most read articles were:
- Drinking Water Regulations Updates
- ESA Members Statistics
- Reminder – AGM 2018 and booking arrangements
Website statistics
Last month (from 23rd January to 22nd February) there were 757 unique visitors coming to our website, which was a little more than in previous months. Together visitors viewed 3,505 pages, on average 3.29 pages per visit. Visits lasted for 2:38 minutes on average.
LinkedIn statistics
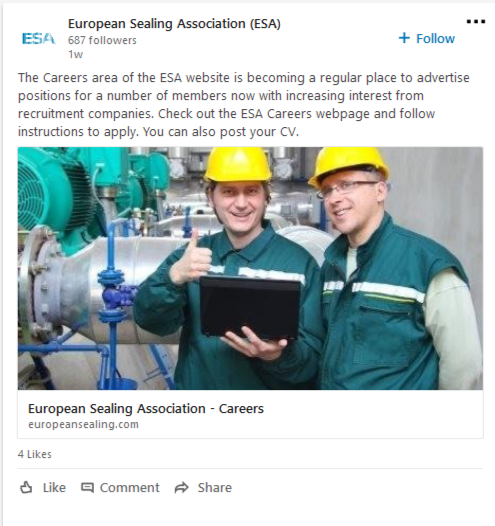
ESA LinkedIn page is continuously, but slowly getting new followers. We have 687 followers so far, with engagement rate of the posts between 1.16 % and 4.13 % in the last 2 months. The most engaging post was the update about the ESA Careers Webpage. The post with ESA explainer video got the most clicks (31) and the video vas viewed 692 times.

ESA LinkedIn group currently has 894 members, but still little conversation between them. Read our LinkedIn tips on why you should be using LinkedIn groups and start participating: ask a question or share a solution to a problem. LinkedIn Groups are a perfect place to share knowledge.
